Do you have any data for my lake?
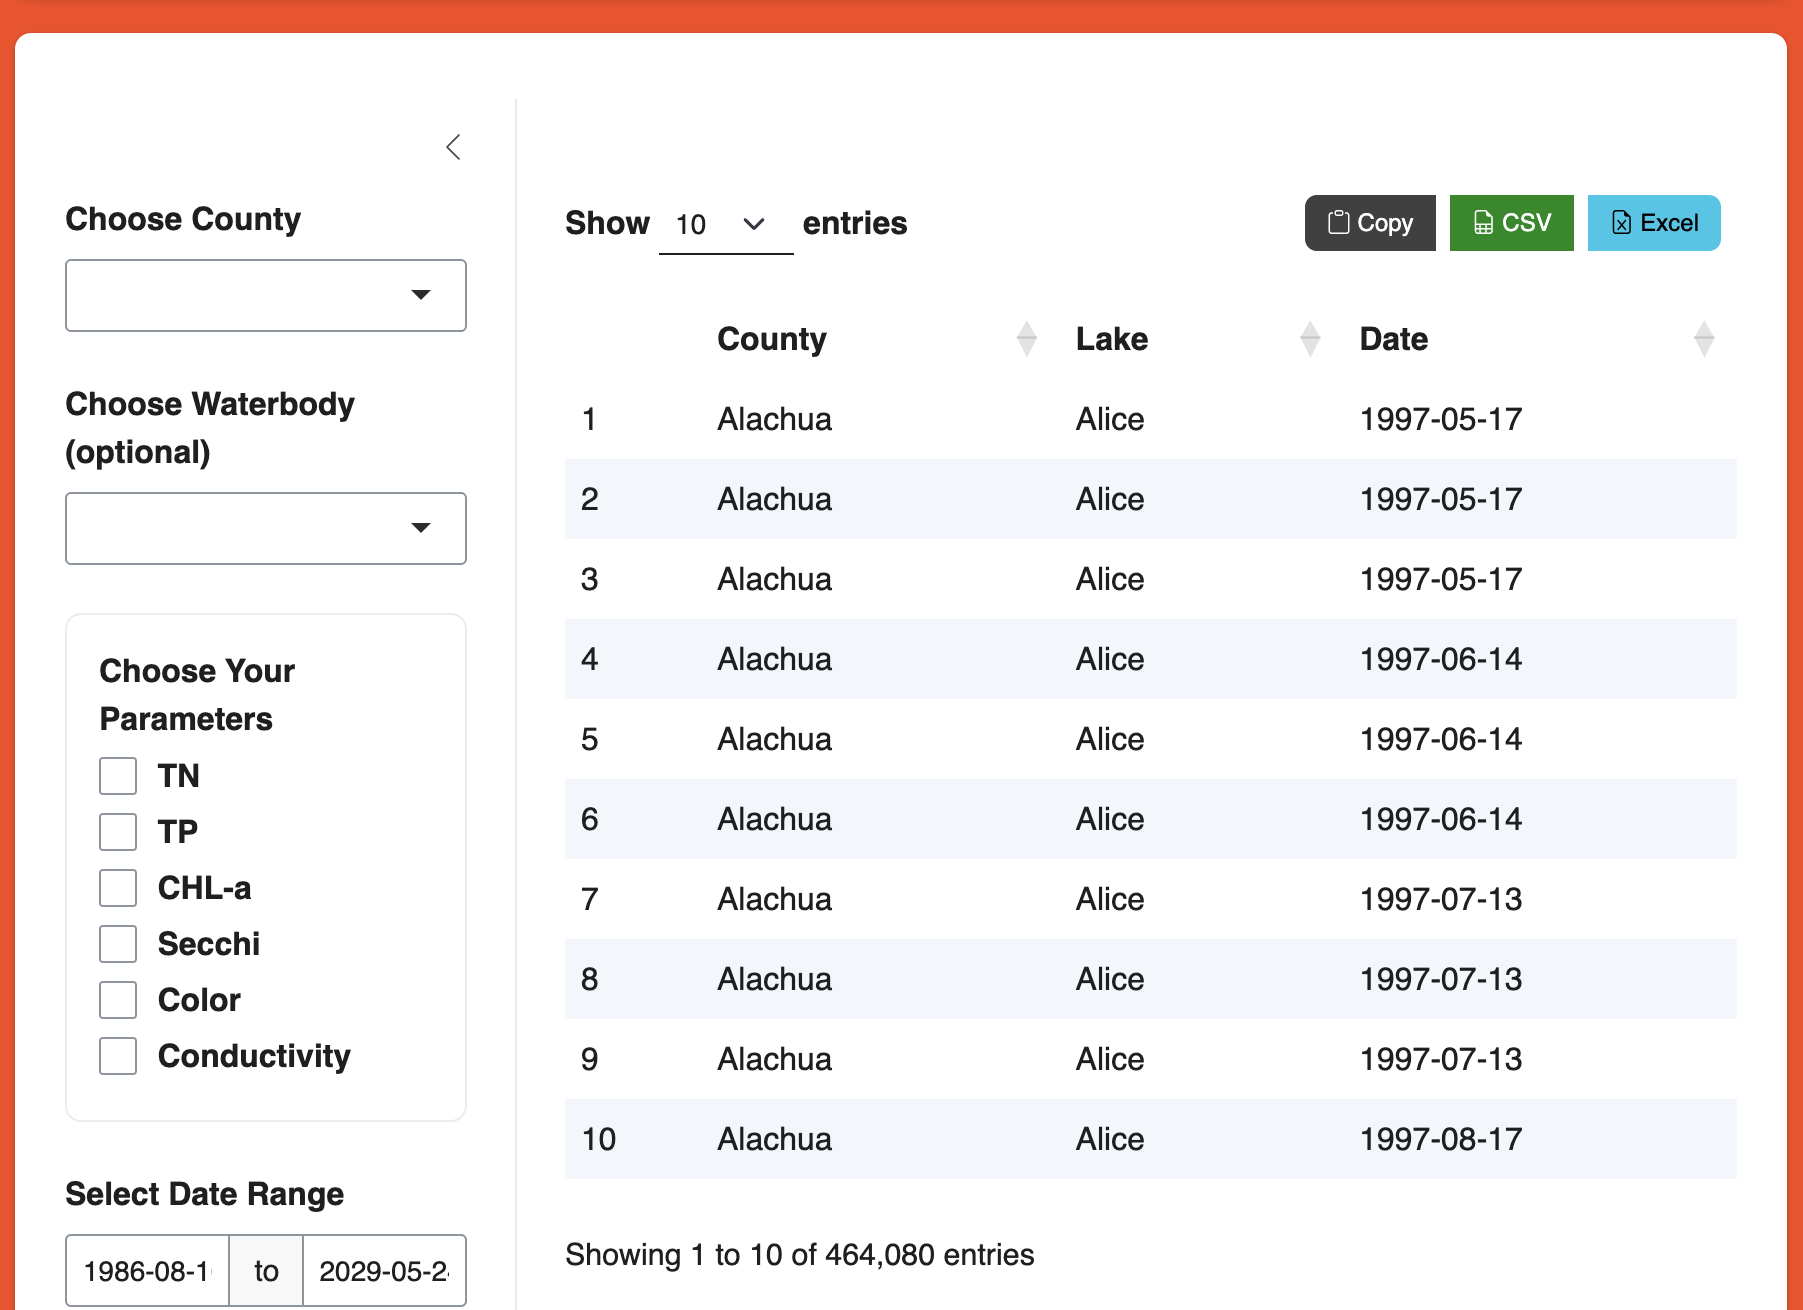
Search for your lake using the dashboard or browse the water quality reports. Still unsure if data exists for your lake? Email us at fl-lakewatch@ufl.edu.
Yes! Just be sure to cite us properly and acknowledge the role of volunteers. See our citation instructions. And please send us a copy of any products using our data -- our volunteers love to learn about the research they contribute to.
Simply submit a data request and we'll email data to you, or email us directly with any questions or suggestions for improvement.
LAKEWATCH volunteer-collected data has been assessed, validated, and determined to be research-quality through a series of studies.
- Canfield et al. 2002: This comparative study of 125 lakes sampled in winter and summer by LAKEWATCH staff and volunteers concurrently found that total phosphorus, total nitrogen, chlorophyll, and Secchi depth were strongly correlated between staff and volunteers (R2 >0.99). Additionally, samples from 12 lakes were used to determine if freezing was a valid means of preserving water samples prior to analysis. Findings shows that samples were valid for analyzing total phosphorus, total nitrogen, pH, total alkalinity, specific conductance, and chlorophyll after water was frozen for up to 150 days. For this study, all samples were analyzed by the LAKEWATCH lab.
- Hoyer et al. 2012: Florida Department of Environmental Protection (FDEP) and LAKEWATCH volunteers concurrently collected samples on 27 lakes to determine data comparability between the organizations. Each organization followed their own Standard Operating Procedures for both field and laboratory activities, with FDEP's data collected using stringent quality assurance (QA) protocols and analyzed in a National Environmental Laboratory Accreditation Conference (NELAC)-certified laboratory in compliance with the state's QA rule. Results showed that LAKEWATCH data were nearly equivalent (R2 >0.90) to FDEP's, and that LAKEWATCH data is suitable for regulatory decisions. However, the paper also concluded that making the changes required to become NELAC-certified would increase the time and cost of processing samples and decrease the cost-effectiveness of the LAKEWATCH volunteer monitoring program.
- Hoyer and Canfield 2021: To address concerns that prior comparison studies have been of limited scope, conducted under experimental conditions, or that results may not be applicable to existing large-scale long-term volunteer monitoring datasets, this study compared historical data collected by five professionally-staffed Florida organizations and volunteer-collected data from 216 lakes. Results showed that, while there were statistically significant differences for total phosphorus, total nitrogen, and Secchi depth (but not chlorophyll), these differences were small and not biologically meaningful. Some differences were expected in this study because samples were not collected concurrently at a given lake by the various organization and volunteers. The authors concluded that the volunteer-collected data were equivalent to data collected professionally and thus that the data were adequate for both research and management.
If the data on the dashboard doesn't seem up-to-date for your lake, there may not currently be a volunteer sampling it. If you are interested in volunteering to monitor your lake, please reach out to the coordinator for your county.
Uncorrected chlorophyll a is a raw measurement of chlorophyll concentration, which may include interference from other pigments such as pheophytin, a degradation product of chlorophyll.
While uncorrected chlorophyll a remains a valid measure, especially between waterbodies, it may overestimate the actual chlorophyll a (and thus primary productivity) in a sample. Therefore, LAKEWATCH began correcting for pheophytin and these other pigments and providing both corrected and uncorrected chlorophyll a values.
To provide both of these measurements our lab technicians first measure uncorrected chlorophyll a on a spectrophotometer. They then acidify the sample, which is intended to convert all of the chlorophyll a to pheophytin, and measure again on the spectrophotometer. The difference between the two measurements is an estimate of the pheophytin interference, which can further be used along with the measure of uncorrected chlorophyll a to estimate corrected chlorophyll a.
Please know that we post new LAKEWATCH data on our dashboard as soon it is finalized. However, results for a sample can take up to 6-9 months from sample pick-up to appear on the dashboard, so please be patient. Below are some details about the timeline of a sample.
Sample pick-up: 1-3 months
After collecting water samples, you drop your samples and data sheets off at your local collection center. Our staff drive from Gainesville to pick these samples up from over 70 pick-up locations across the state. Staff typically visit each location once every 1-3 months to retrieve samples.
Lab analyses: 1.5-3.5 months
Our staff keep your samples on ice and drive them back to Gainesville, usually on the same day we pick them up, or the day after for further away locations. All samples are placed in our lab freezers to await testing. Current wait times in our freezer are between 2-6 weeks depending on how busy the lab is -- sometimes we have lots of samples to get through, while other times we can get to new samples more quickly.
Once the lab is ready, your samples are thawed and distributed for the various analytical processes in our lab. After these analyses, our lab manager assesses the quality of every data point by reviewing the many QA/QC samples we use (e.g., blanks for contamination, replicates for precision, and standards for accuracy). If any issues are noticed, all samples in affected batches are re-analyzed if possible to ensure we generate the most accurate information possible. If reanalysis isn't possible, data are qualified -- an informational code is added in our dataset to identify concerns with the quality of the data point.
Data merging: 1-2 months
Finalized data is incorporated into our internal database, which we upload at least quarterly to our online dashboard, as well as to the Florida Department of Environmental Protection Watershed Information Network (WIN).
Keep in mind, data from a sample can take up to 6-9 months from sample pick-up to appear on the dashboard, so please be patient. That being said, if you suspect something is missing or incorrect, please email us (fl-lakewatch@ufl.edu).
As a volunteer, you can help ensure accurate reporting by clearly writing the county, waterbody, station, and collection date on all your field sheets, sample bottles, and chlorophyll filters. These should be written exactly as listed in the data dashboard, as that is how they are recorded in our internal file system, where they are linked to the geographic coordinates (latitude/longitude) for each of your stations.
Some common questions about our water quality reports are below. For other questions, please reach out to your coordinator.
Why do the dashboard graphs look different from the graphs in my report?
Great observation. In your report, we have taken the geometric mean of the sites on your lake for the entire year, and show you the average as well as the variation in the data with error bars. In the dashboard, we are displaying all of the raw data for all sites and all months individually. Feel free to download your data from the dashboard and calculate trends using your own methods, too!
How do I read and interpret the graphs in my report?
If there are five or more years of data for your waterbody, then you will have graphs at the end of your report for total phosphorus, total nitrogen, chlorophyll a, and Secchi depth. They can all be read and interpreted as outlined below:
- Year on the x-axis shows the time range of data available. If there were gaps in sampling, you will see corresponding gaps in the data
- Parameter on the y-axis is labeled with units (e.g., total phosphorus μg L-1)
- Points represent annual geometric means from all sampling locations and months
- Vertical lines (error bars) represent annual variation
- Trendline shows a linear model of the full time series. We test whether the slope of the line significantly differs from zero. If so, the trendline is shown as a solid line with a positive or negative slope; otherwise, the trendline is shown as a dashed line
- Model error is shown as a gray band around the trendline and is an estimate of confidence in the trendline; wider bands indicate more uncertainty
- p-value is the probability that there is no trend in the data -- scientists often use a cutoff value of p ≤0.05 to indicate a statistically significant trend
- R2 is a measure of how well the trendline represents the data, values close to 1 means the trendline fits the data very well, while values close to 0 mean it does not
- Trend is based on whether the p-value indicates statistical significance and, if it does, whether the slope of the trendline is positive or negative. A parameter may increase, decrease, or show no trend over time.
What are the main causes of annual fluctuations in my data?
This is hard to answer without looking at each waterbody on a case-by-case basis. Thus, we encourage you to reach out to your LAKEWATCH coordinator to discuss.